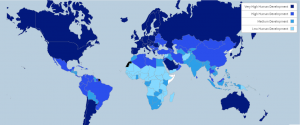
Human Development Index (HDI) is one of the most important criteria to identify if a country is developed, developing or underdeveloped. Simply stated, it measures the well-being of a country by taking into consideration social measurements such as healthcare, education and economic factor of GDP. It is published every year in a report prepared by the United Nations Development Program (UNDP), known as the Human Development Report (HDR). They have been doing it since 1990. You may check and download the latest report here.
As per the 2016 report, the top countries with the highest HDI are -
- Norway (Rank-1)
- Australia (Rank-2)
- Switzerland (Rank-2)
- Germany (Rank-4)
- Denmark (Rank-5)
- Singapore (Rank-5)
India ranks 131 among 188 countries.
The HDI is measured based on three dimensions -
- Health (Life expectancy index - life expectancy at birth)
- Education (Mean years of schooling & expected years of schooling)
- Living Standards (GNI per capita- PPP US$)
HDI Classifications of countries-
- Very High Human Development (HDI value: 0.949 to 0.800)
- High Human Development (HDI Value: 0.796 to 0.701)
- Medium Human Development (HDI Value: 0.691 to 0.550)
- Low Human Development (HDI Value: 0.541 to 0.352)
India lies in the 3rd- Medium Human Development category.
Refer to the picture below which shows a classification among the developed, developing and underdeveloped countries-

The Indian Picture -
India’s dire ranking has been due to regional inequalities in education, health and living standards within it (yes, the dimensions on which HDI depends upon). Our country is remarked that its economy is expected to grow at 7-8% and as Dominic Barton (Global Managing Partner, Mckinsey & Company) said in the ET Global Business Summit 2018 that India can be a $5 trillion economy by 2025!
But there is also a need to implement lots of social reforms. The social capital and spending in our country are scarce on aspects like health and education. ‘Human Development’ is about expanding and nurturing the richness of human life rather than just the richness of the economy in which we live.
Even though we have risen to the top at some of the most prestigious institutions and made a long-lasting mark on the world in various fields, there are some other factors like- India’s restrictive employment & land acquisition laws, its exploitative caste structure, its education system and lack of formal employment opportunities for the youth that are responsible for disabling the nation from unlocking its true potential.
Health -
India’s life expectancy as per the report is currently 68.3 years. Earlier an Indian’s average life expectancy was about 58 years. So, there is an improvement seen here but, we are still well behind Honk Kong, who topped this list age expectancy of 84.2 years. You can see here that there is a fair scope for improvement.
India’s expenditure on public health constitutes just 1.3% of the GDP. This is very low when compared to that of Norway’s (HDI Rank-1) 8.3%. Indians suffer maximum deaths from diseases such as malaria and tuberculosis and hence this area needs major attention. The government has acknowledged this situation and has made its objective to eradicate tuberculosis by 2025, five years earlier than the goal of 2030. Check here for details.
If achieved, then this will prove extremely vital in improving the country’s ranking.
Education -
On an average, the expected years of schooling received by Indians has been 11.7 years compared to 12.3 years for the world average. We can look at the Student-Teacher Ratio (STR) for India and the no.1 ranked Norway. The STR for Norway in 2015 was 8.87, while that of India was 23.
We need more quality teachers to improve our stand. It is also a fact that illiteracy has fallen in our country, but there still remains some room for improvement on the secondary level education which is only at about 35% to 48%.
While many global CEOs and professors at foreign universities are Indians, this does not reflect the progress made by the country as a whole. Approx. 24.5% of Indians have received tertiary education.
Note- Student-teacher ratio or student-faculty ratio is the number of students who attend a school or university divided by the number of teachers in the institution. For example, a student-teacher ratio of 10:1 indicates that there are 10 students for every one teacher. Check here for details of Norway STR.
The Standard of Living -
India is considered among the top 10 economies in the world, however, we lag in terms of Gross National Income (GNI) per capita. In 2015, India had a GNI per capita of 5,663 PPP US$, compared to that of Norway’s - 67,614 PPP US$.
Now you might feel that this might be the case due to India’s high population (in excess of 1 billion) but, when compared to China, which has a similar population, has recorded its GNI per capita at 13,345 PPP US$.
By now, you must be feeling that we have a very long way to go in order to be known among the developed countries. But another fact that you should know is that India has shown growing HDI trend from 1990 to 2015.
So, what comes to your minds after going through these facts and figures? Do you think India has what it takes to be in the leagues of ‘Very High Human Development’ category of HDI? How long till India joins the elite club?
Check out this video which talks about the HDR 2016.
If you have any opinions to share, then do let me know them in the comments below.


Comments
Rupa Shekhar
Health sector needs to be looked into seriously where India is lagging behind seiously in terms of percentage of GDP spending so that adeqate infrastructure with better doctor patient ratio can be achieved.
14 Apr 2018, 03.55 AM