- Averages and Percentage Based
- Calculation Based
- Counting Based
- Creating Multiple Scenarios
- Plugging Missing Data
- Venn Diagram Based
- Networks and Paths
- Reasoning Based
Let us see examples of each one of them so as understand them better:
Averages and Percentage Based sets
These sets would require you apply concepts of Percentage change, Weighted Average and Ratios to concepts. Most of the line graphs and pie charts are based on percentages.
Here is a CAT 2007 set that is based on Averages.
---
Calculation based sets
These sets are heavy on data and require you to perform a lot of calculations to get the answers. The good thing about these sets is that in most of the cases the answer options are wide apart. Hence there is a possibility to approximate the values and calculate. However, these sets are generally avoidable as they are time consuming and also prone to errors.
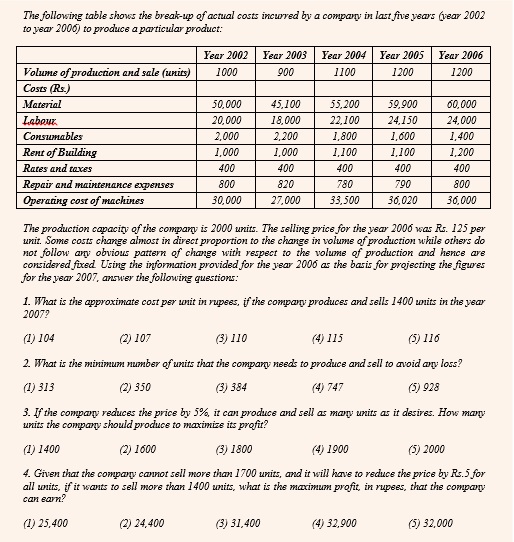
Here is another CAT 2007 set that is based on Calculations.
---
Counting based sets
These sets are extremely easy and take less time to solve as most of the questions only require you to count certain values to get the answers. In case you find such a set in your paper, it should be the first one that you should attack.
----
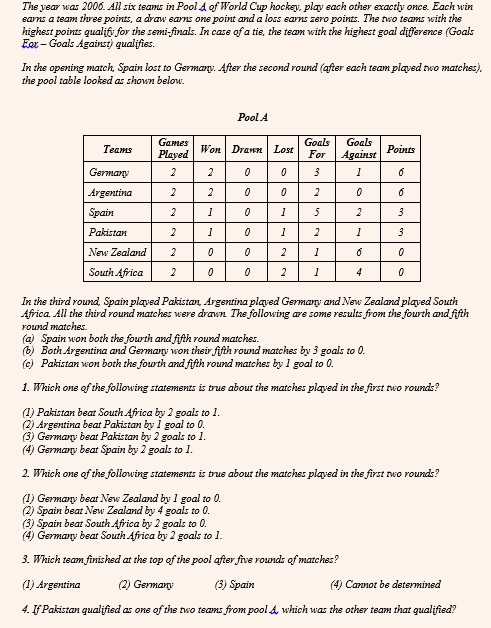
Sets based on Creating Multiple Scenarios
These are the sets in which one single scenario may not help you to get all answers. You need to create a new scenario for every question. Hence these questions take a lot of time to solve and must be avoided wherever possible.
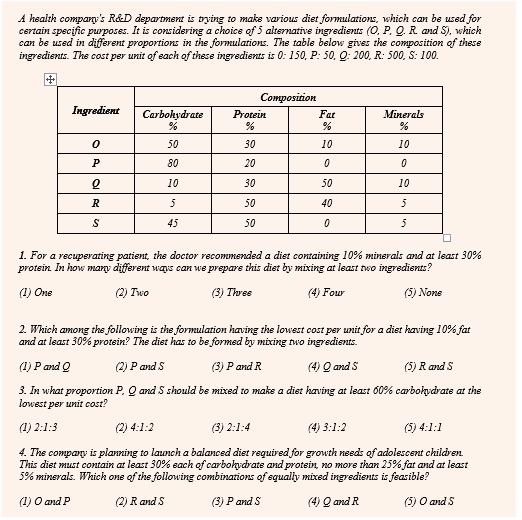
Here is a CAT 2005 set based on creating multiple scenarios.
----
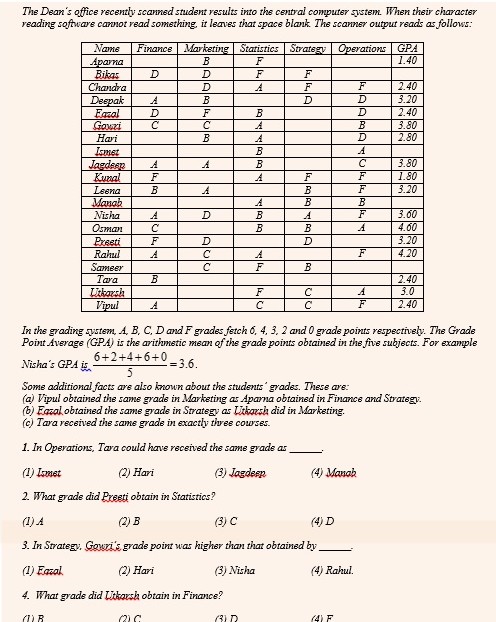
Sets based on Plugging Missing Data
In these sets some of the values are deliberately not revealed by the examiner. You need to find these missing data first and then answer the questions. These sets are extremely risky to attempt as you are never sure whether you will be able to extract all the missing data from the given information.
Here is a CAT 2004 set based on plugging missing data.
----
Venn Diagrams based sets
These sets pertain to two or more different types of sets and the relationship between the values of these sets. You need to draw Venn diagrams to represent these sets and establish relationship between different data values.
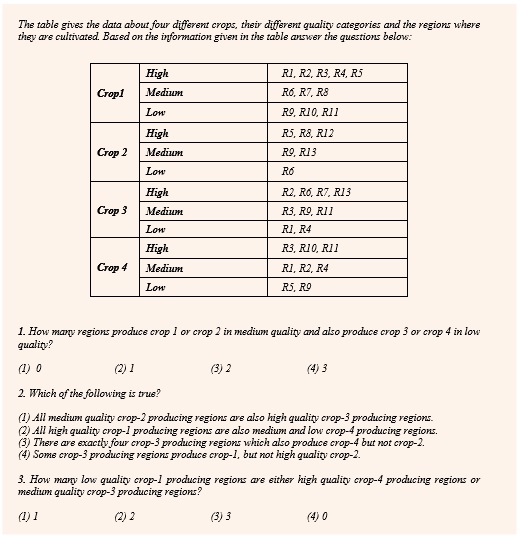
Here is a CAT 2003 (Nov) set based on Venn Diagram.
---
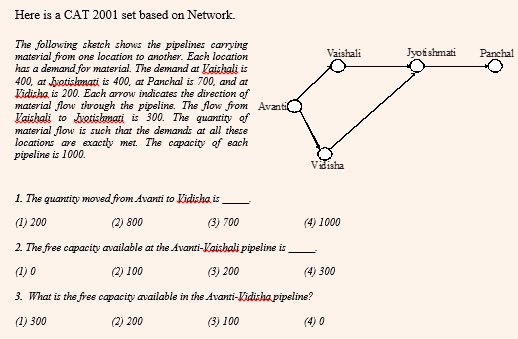
Sets based on Network and Paths
These sets require you to establish relationship between different paths in a network and get the answers. These sets are usually easy and must be solved as a part of one of the first few sets.
---
Reasoning based sets
These sets are based on some underlying logic that binds different data values, and are beyond simple mathematical relationships. Your ability to crack these sets depends on whether you have been able to crack this logic between the data values. Again very risky sets to attempt as you may never know the amount of time it may take to crack these sets. For all you know, you may end up leaving these sets after having spent considerable amount of time.
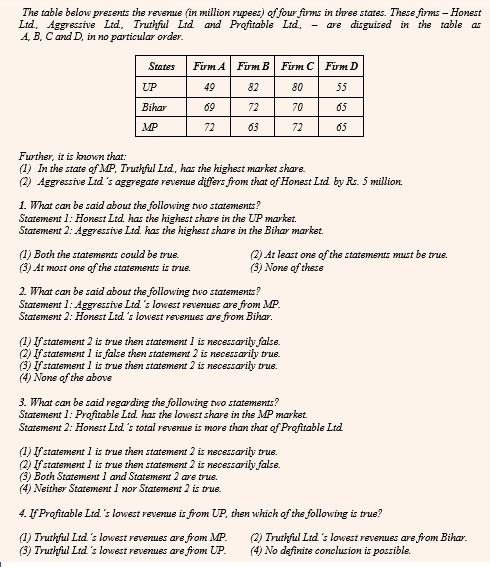
Here is a CAT 2004 set based on Reasoning.
----
Strategies for Cracking DI Section of CAT
Selecting the Right Sets
Most of the times, your performance in the DI section depends on your ability to choose the right sets. In a CAT DI section, not all sets are worth attempts. There is a good spread of easy and difficult sets. The objective is to choose the easy sets and avoid the tough and time-consuming ones. What is also important is to prioritize the sets that you have chosen to solve so that you don’t end up spending too much time on any one set.
How does one select or reject a set on the face of it? There are many factors that can decide this.
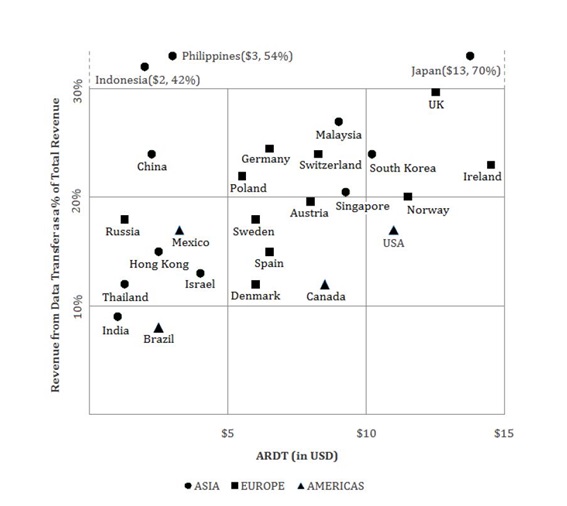
Familiarity with the Data Representation
Sometimes the CAT examiners represent the data in a format that may be unfamiliar to you. Because of this there would be a big risk to attempt such a set as you never know how much time you might end up spending in deciphering it.
Here is a CAT 2008 set to illustrate the same:
The nature of the Data Values
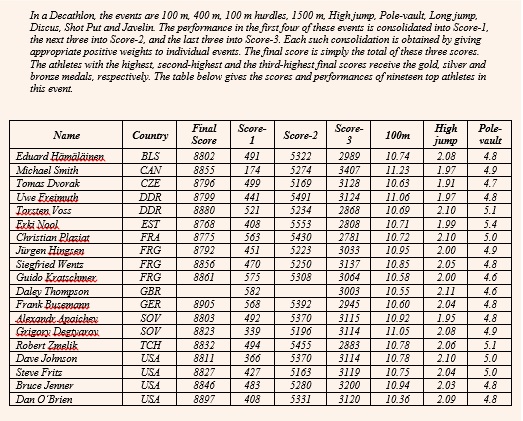
Sometimes, your set may have data values that are big (4 digits and more) or values that are in decimals. Usually such values are not so friendly to calculate. Hence such sets should usually be avoided.
Here is a CAT 2003 (Nov) set that falls in the above category.
Ability to extract Data Values from the set
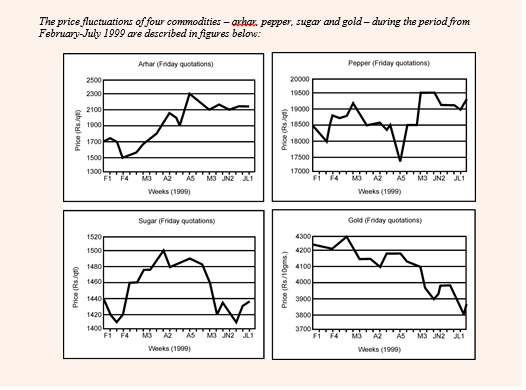
Some times that set may be familiar to us and the data values may also be friendly, however it may be difficult to extract the exact values from the set. Since we spend considerable amount of time in calculation, we better take the correct data values and calculate. Again it is better to ignore such sets.
The following CAT 1999 set is a good example of this.
Other factors
Apart from the above factors, there are some other reasons why you may choose to leave or do a particular set compared to others. These are:
- How many questions follow a particular data set? – Since you are spending considerable amount of time in deciphering the data set, you might as well take maximum advantage of the time you investested.
- Are the answers options too close of far apart? – Close answer options mean, possibility of approximation are ruled out. You need to spend that extra time to calculate the answer up to the last decimal place.
- Is there a ‘Cannot be Determined’ or ‘None of these’ in the answer options? – You are not sure of your answer and need to spend that extra time to double check whether the answer is indeed one of them, or you have made some mistake in calculation or overlooked some part of the information.
The Correct Trade-Off between all the evils
Having said all of the above, it is important to note that you may not have get a set that satisfies all your requirements. Every set will have some drawback or the other. There may some sets that may not be familiar to you, some others in which the data values are not good enough and others where you may not be able to extract the exact values. This does not mean you should end up leaving all the sets. Probably you may have to Trade-Off one evil for another and decide which of the evils is better to live with, in the light of your strengths. In other words, life won’t be a smooth highway ride as far as DI is concerned. You need to overcome some of the hurdles and avoid treading on some others.
Don’t get stuck in a jam!
At the end of the day all of us are fighting against time. This is more true for DI as you may end miscalculating your time distribution across sets if you are not sensitive to the time that you are spending on every question.
The crucial decision that you need to take is ‘All of Some’ or ‘Some of All’. What it means is, whether it is advisable to solve ‘All questions from Some sets’ or ‘Some questions from all sets’. You need to take the former strategy if you could not short-list sufficient number of DI sets in your CAT papers. Since there are a only a few sets worth attempting, you need to solve almost all the questions from them if you need to have sufficient number of attempts. On the other hand, if you that almost all the sets are equally good or equally bad, then you may take the latter strategy. In this strategy you attempt all the sets, but skip specific questions from every set that are difficult or time consuming. Thus key to attempting a DI section is to keep moving on and not get stuck on any question or any set.
How to prepare for DI in the last one month?
Work on Speed Calculations
It is too late in the day to work on your calculations. However, if you have still haven’t mastered it, spend a good 3-4 days on calculations. It can still do wonders! Things like Reciprocals, Squares, Square roots, Cubes, Cube Roots etc. Work the calculations out mentally. Initially it may take more than you might want it to be taking, but this habit once formed will go a long way in helping you for DI. Working on Calculations is like swimming. Once you know it, you know it. From then on you can only work on getting better.
Study the DI trends in actual CAT papers
Preferably solve the DI sections of all the CAT papers from 2003 onwards. Try and understand how the questions have changed from the previous years. The annexure given at the end of this report can help you in this. This should take not more than 3 days.
Solve Section Tests rather than Individual Sets
What is important is to simulate the CAT. Hence rather than focusing of solving individual questions, you need to solve as many section tests as possible. Take these tests under timed settings, with emphasis on selecting and prioritizing the sets.
ANNEXURE
Trends of DI from CAT 1990 to CAT 2008
CAT 1990 to CAT 2000
| Year | InterpretationFormat | Table | Graph | Caselet | Special Format |
| 1990 | Calculation Based | 2 Sets (10 Q’s) | 1 Set (4 Q’s) | – | – |
| Average / Percentage Based | 1 Set (5 Q’s) | 1 Set (3 Q’s) | – | – | |
| 1991 | Calculation Based | – | 2 Sets (10 Q’s) | – | – |
| Average / Percentage Based | 1 Set (5 Q’s) | – | 1 Set (5 Q’s) | – | |
| Creating Multiple Scenarios | – | – | 1 Set (5 Q’s) | – | |
| 1992 | Average / Percentage Based | 1 Set (4 Q’s) | 2 Sets (8 Q’s) | 1 Set (4 Q’s) | – |
| Creating Multiple Scenarios | – | – | 1 Set (5 Q’s) | – | |
| Venn Diagram Based | 1 Set (4 Q’s) | – | – | – | |
| 1993 | Average / Percentage Based | 1 Set (4 Q’s) | 2 Sets (5 Q’s) | 1 Set (4 Q’s) | – |
| Reasoning Based | – | – | 1 Set (4 Q’s) | – | |
| Plugging Missing Data | 1 Set (5 Q’s) | – | – | – | |
| 1994 | Calculation Based | 1 Set (4 Q’s) | – | – | – |
| Average / Percentage Based | 1 Set (4 Q’s) | 3 Sets (13 Q’s) | – | – | |
| Plugging Missing Data | 1 Set (4 Q’s) | – | – | – | |
| 1995 | Average / Percentage Based | 3 Sets (15 Q’s) | 3 Sets (15 Q’s) | – | – |
| Creating Multiple Scenarios | – | – | 1 Set (5 Q’s) | – | |
| 1996 | Calculation Based | 1 Set (5 Q’s) | – | – | – |
| Average / Percentage Based | 2 Sets (10 Q’s) | 2 Sets (10 Q’s) | – | 1 Set (5 Q’s) |
| Year | InterpretationFormat | Table | Graph | Caselet | Special Format |
| 1997 | Calculation | 1 Set (8 Q’s) | – | – | – |
| Average / Percentage Based | 2 Set (10 Q’s) | 2 Sets (12 Q’s) | – | – | |
| 1998 | Calculation Based | 1 Set (6 Q’s) | 1 Set (5 Q’s) | – | – |
| Average / Percentage Based | – | 2 Sets (12 Q’s) | 1 Set (5 Q’s) | – | |
| 1999 | Calculation Based | – | 2 Sets (10 Q’s) | – | – |
| Average / Percentage Based | 1 Set (7 Q’s) | 1 Set (4 Q’s) | – | – | |
| 2000 | Calculation Based | 3 Sets (14 Q’s) | 2 Sets (10 Q’s) | – | – |
| Average / Percentage Based | – | 1 Set (6 Q’s) | – | – |
CAT 2001 to CAT 2008
| Year | InterpretationFormat | Table | Graph | Caselet | Special Format |
| 2001 | Calculation Based | – | 2 Set (9 Q’s) | – | – |
| Counting Based | 2 Sets (8 Q’s) | – | – | – | |
| Networks and Paths | – | – | – | 1 Set (3 Q’s) | |
| 2002 | Calculation Based | 1 Set (8 Q’s) | 1 Set (6 Q’s) | – | – |
| Counting Based | 3 Sets (10 Q’s) | – | – | – | |
| Reasoning Based | – | – | 1 Set (4 Q’s) | – | |
| Networks and Paths | 1 Set (6 Q’s) | – | – | – | |
| 2003(Nov) | Calculation Based | – | – | 1 Set (3 Q’s) | – |
| Average / Percentage Based | 2 Sets (5 Q’s) | 1 Set (4 Q’s) | 1 Set (3 Q’s) | 1 Set (3 Q’s) | |
| Counting Based | 3 Sets (9 Q’s) | – | – | – | |
| Venn Diagram Based | 1 Set (3 Q’s) | – | – | – |
| Year | InterpretationFormat | Table | Graph | Caselet | Special Format |
| 2004 | Calculation Based | – | 1 Set (4 Q’s) | – | – |
| Average / Percentage Based | – | – | – | 2 Sets (8 Q’s) | |
| Reasoning Based | 3 Sets (12 Q’s) | – | – | – | |
| Plugging Missing Data | 1 Set (3 Q’s) | – | – | – | |
| Venn Diagram Based | – | – | 1 Set (4 Q’s) | – | |
| 2005 | Calculation Based | 1 Set (3 Q’s) | – | – | – |
| Average / Percentage Based | – | 1 Set (4 Q’s) | – | – | |
| Counting Based | 1 Set (3 Q’s) | – | – | – | |
| Creating Multiple Scenarios | 1 Set (4 Q’s) | – | 1 Set (4 Q’s) | – | |
| Reasoning Based | 1 Set (4 Q’s) | – | – | – | |
| Plugging Missing Data | 1 Set (4 Q’s) | – | – | – | |
| Venn Diagram Based | – | – | 1 Set (4 Q’s) | – | |
| 2006 | Average / Percentage Based | 1 Set (5 Q’s) | – | – | – |
| Creating Multiple Scenarios | – | – | 1 Set (5 Q’s) | – | |
| Networks and Paths | – | – | – | 1 Set (5 Q’s) | |
| Reasoning Based | – | – | 1 Set (5 Q’s) | – | |
| 2007 | Calculation Based | 2 Sets (8 Q’s) | – | – | – |
| Average / Percentage Based | 1 Set (4 Q’s) | – | – | – | |
| Plugging Missing Data | 1 Set (4 Q’s) | – | – | – | |
| Networks and Paths | 1 Set (5 Q’s) | – | – | – | |
| 2008 | Calculation Based | – | – | – | 1 Set (3 Q’s) |
| Average / Percentage Based | 1 Set (3 Q’s) | 1 Set (4 Q’s) | – | – | |
| Plugging Missing Data | 1 Set (3 Q’s) | – | – | – | |
| Reasoning Based | – | – | 1 Set (4 Q’s) | – | |
| Creating Multiple Scenarios | – | – | 1 Set (5 Q’s) | – |
|
Researched and Compiled by Manish Salian
|





Comments
Yash Bhati
Hi, None of the sample sets are visible
6 Oct 2019, 01.29 PM